DLBCL Survival Analysis - RNA-seq Insights from TCGA-DLBC
Project Overview
This analysis investigates gene expression patterns associated with survival outcomes in DLBCL patients using RNA-seq data from the TCGA-DLBC project. The goal is to identify potential molecular markers and pathways that might influence patient survival, with implications for prognosis and therapeutic intervention.
Dataset Overview:
- 48 DLBCL patient samples
- 44,176 genes analyzed
- 39 surviving patients vs. 9 deceased
Methods
Data Processing and Analysis Pipeline
The analysis was conducted using R/Bioconductor, with the following key steps:
- Data acquisition from TCGA-DLBC project
- Quality control and preprocessing using DESeq2
- Differential expression analysis comparing survival outcomes
- Pathway enrichment analysis using Gene Ontology
- Visualization of results using ggplot2 and related packages
Results
1. Global Expression Changes
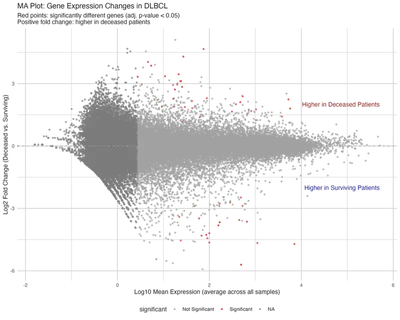
Figure 1: MA Plot (Mean-Average plot) showing gene expression changes between deceased and surviving patients. The x-axis shows the average expression level of each gene across all samples (log10 scale). The y-axis shows the fold change between conditions (log2 scale), where positive values indicate higher expression in deceased patients and negative values indicate higher expression in surviving patients. Red points indicate statistically significant changes (adjusted p-value < 0.05).
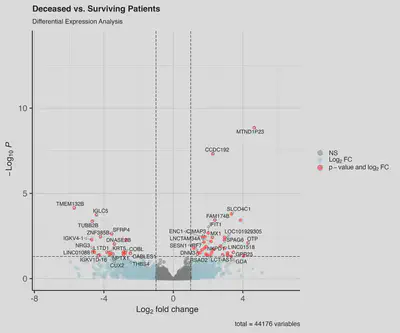
Figure 2: Volcano plot highlighting significantly differentially expressed genes between deceased and surviving patients. Key genes are labeled.
2. Top Differentially Expressed Genes
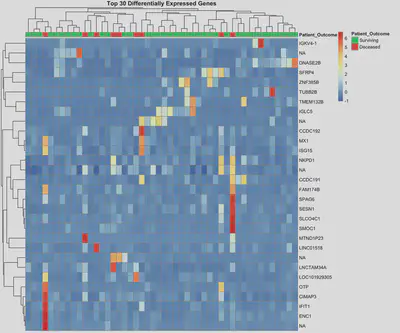
Figure 3: Hierarchical clustering of the top 30 differentially expressed genes, showing distinct expression patterns between survival groups.
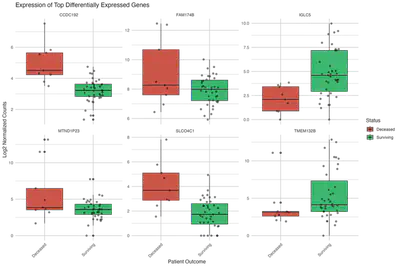
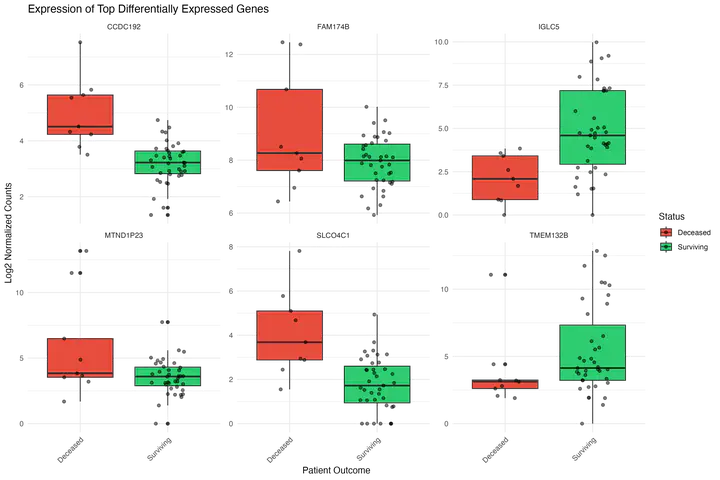
Figure 4: Expression distribution of the top 6 differentially expressed genes across survival groups.
3. Pathway Analysis
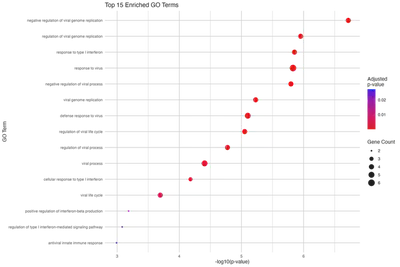
Figure 5: Gene Ontology enrichment analysis showing the top enriched biological processes.
Key Findings
Notable Genes
- TMEM132B (log2FC = -5.705): Most significantly downregulated in deceased patients
- Immunoglobulin Genes (IGKV4-1, IGLC5, IGKV1D-16): Downregulated in deceased patients
- TUBB2B: Cytoskeletal component with potential role in disease progression
- NRG3: Signaling molecule with possible implications in survival
Discussion
Biological Implications
- Downregulation of immunoglobulin genes in deceased patients suggests potential immune system dysfunction
- Changes in structural proteins (TUBB2B) might indicate altered cellular architecture
- Signaling pathway alterations (NRG3) suggest potential therapeutic targets
Clinical Relevance
- Development of prognostic markers
- Identification of potential therapeutic targets
- Better understanding of DLBCL progression mechanisms
Conclusion
This analysis provides insights into the molecular basis of DLBCL survival outcomes and identifies several promising avenues for future research. The identified genes and pathways could serve as potential prognostic markers or therapeutic targets.